Overview
The Overview section provides you with a comprehensive summary of your eCommerce business, including the products you have contracted, your current integration status, and other sections that are listed below.
To access the Overview page, simply click on the left menu that is visible on each page of the Usizy platform.
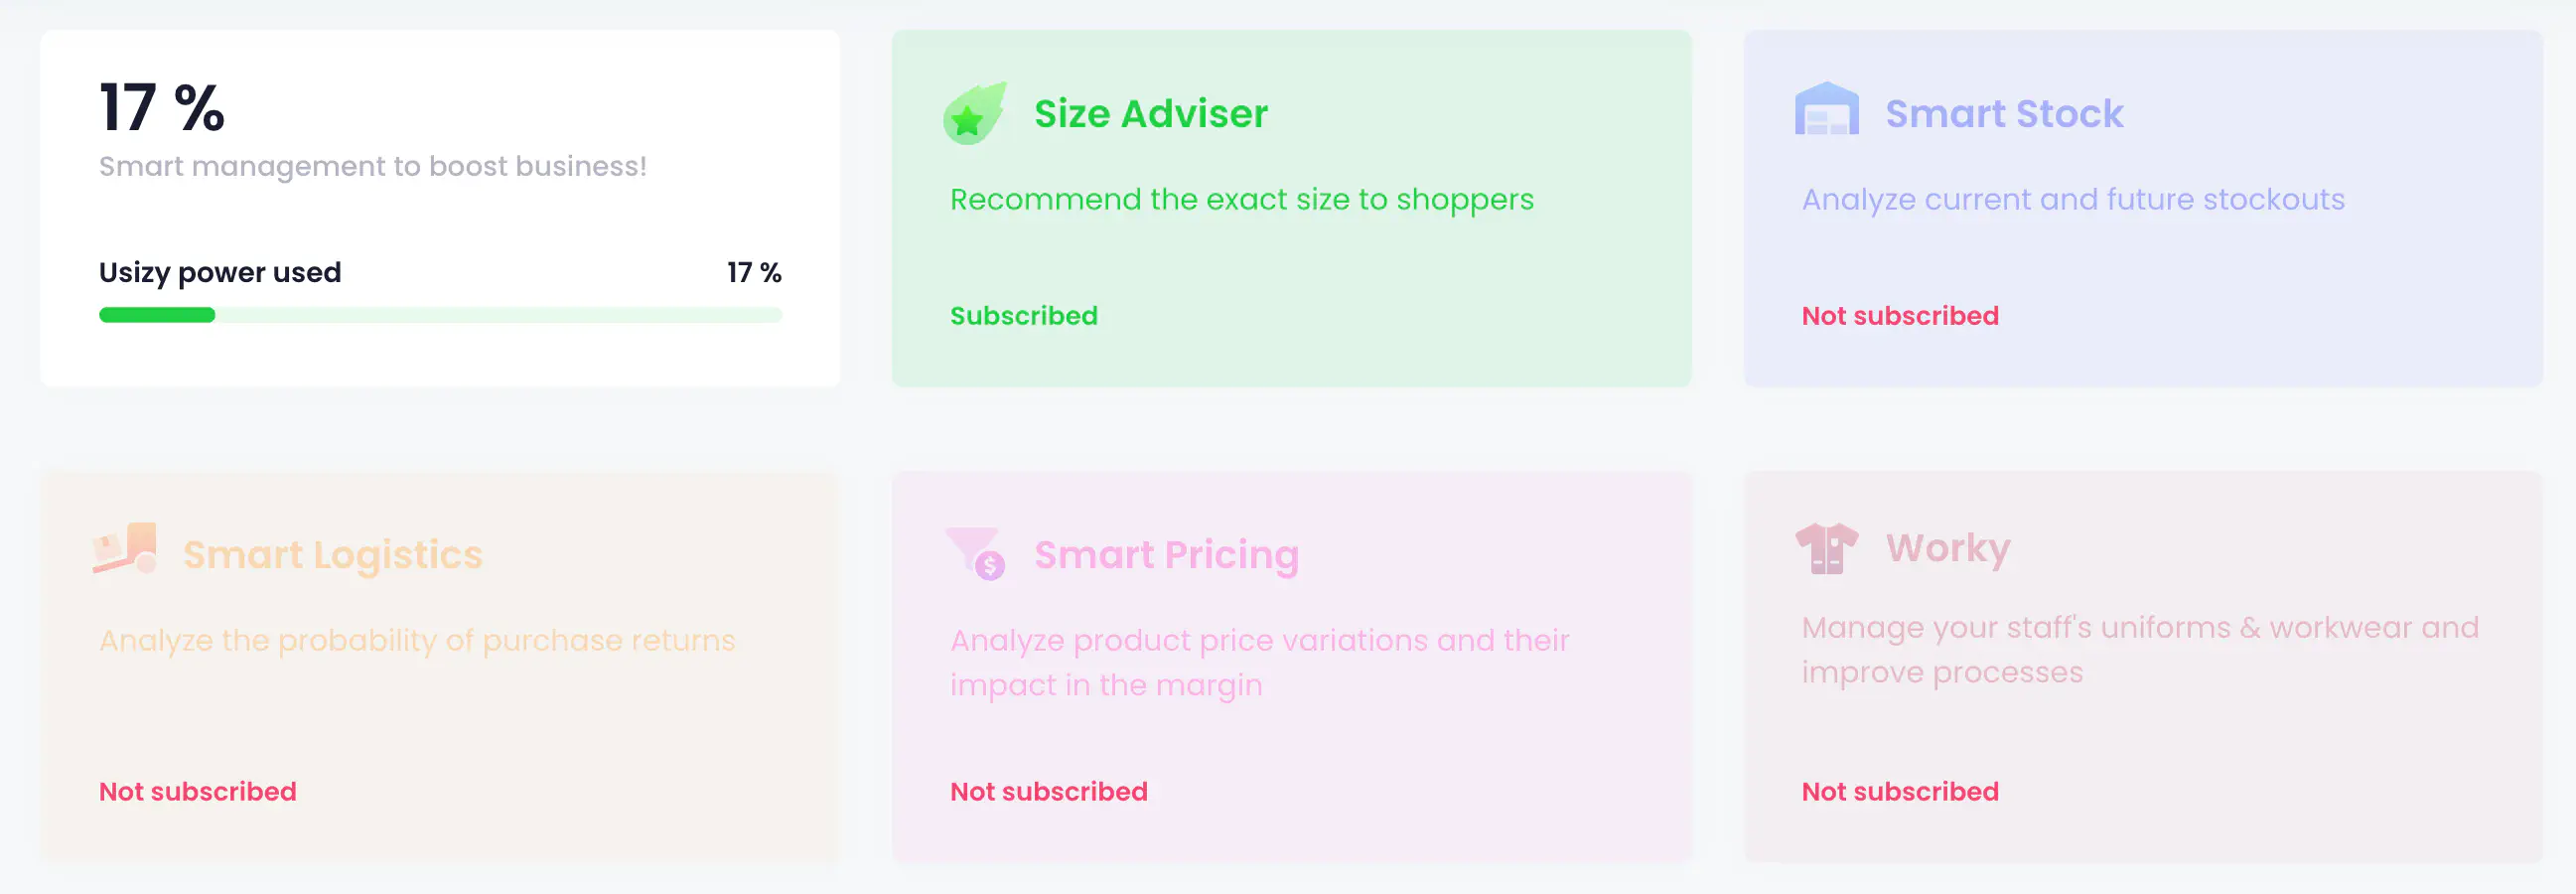
Once you are on the Overview page, you can review the products you have subscribed to from all available Usizy Solutions, along with the percentage of Usizy products that are currently activated for your business.
Usizy offers various products beyond its core product Size Adviser, to help improve major pain points around stock, pricing, logistics…
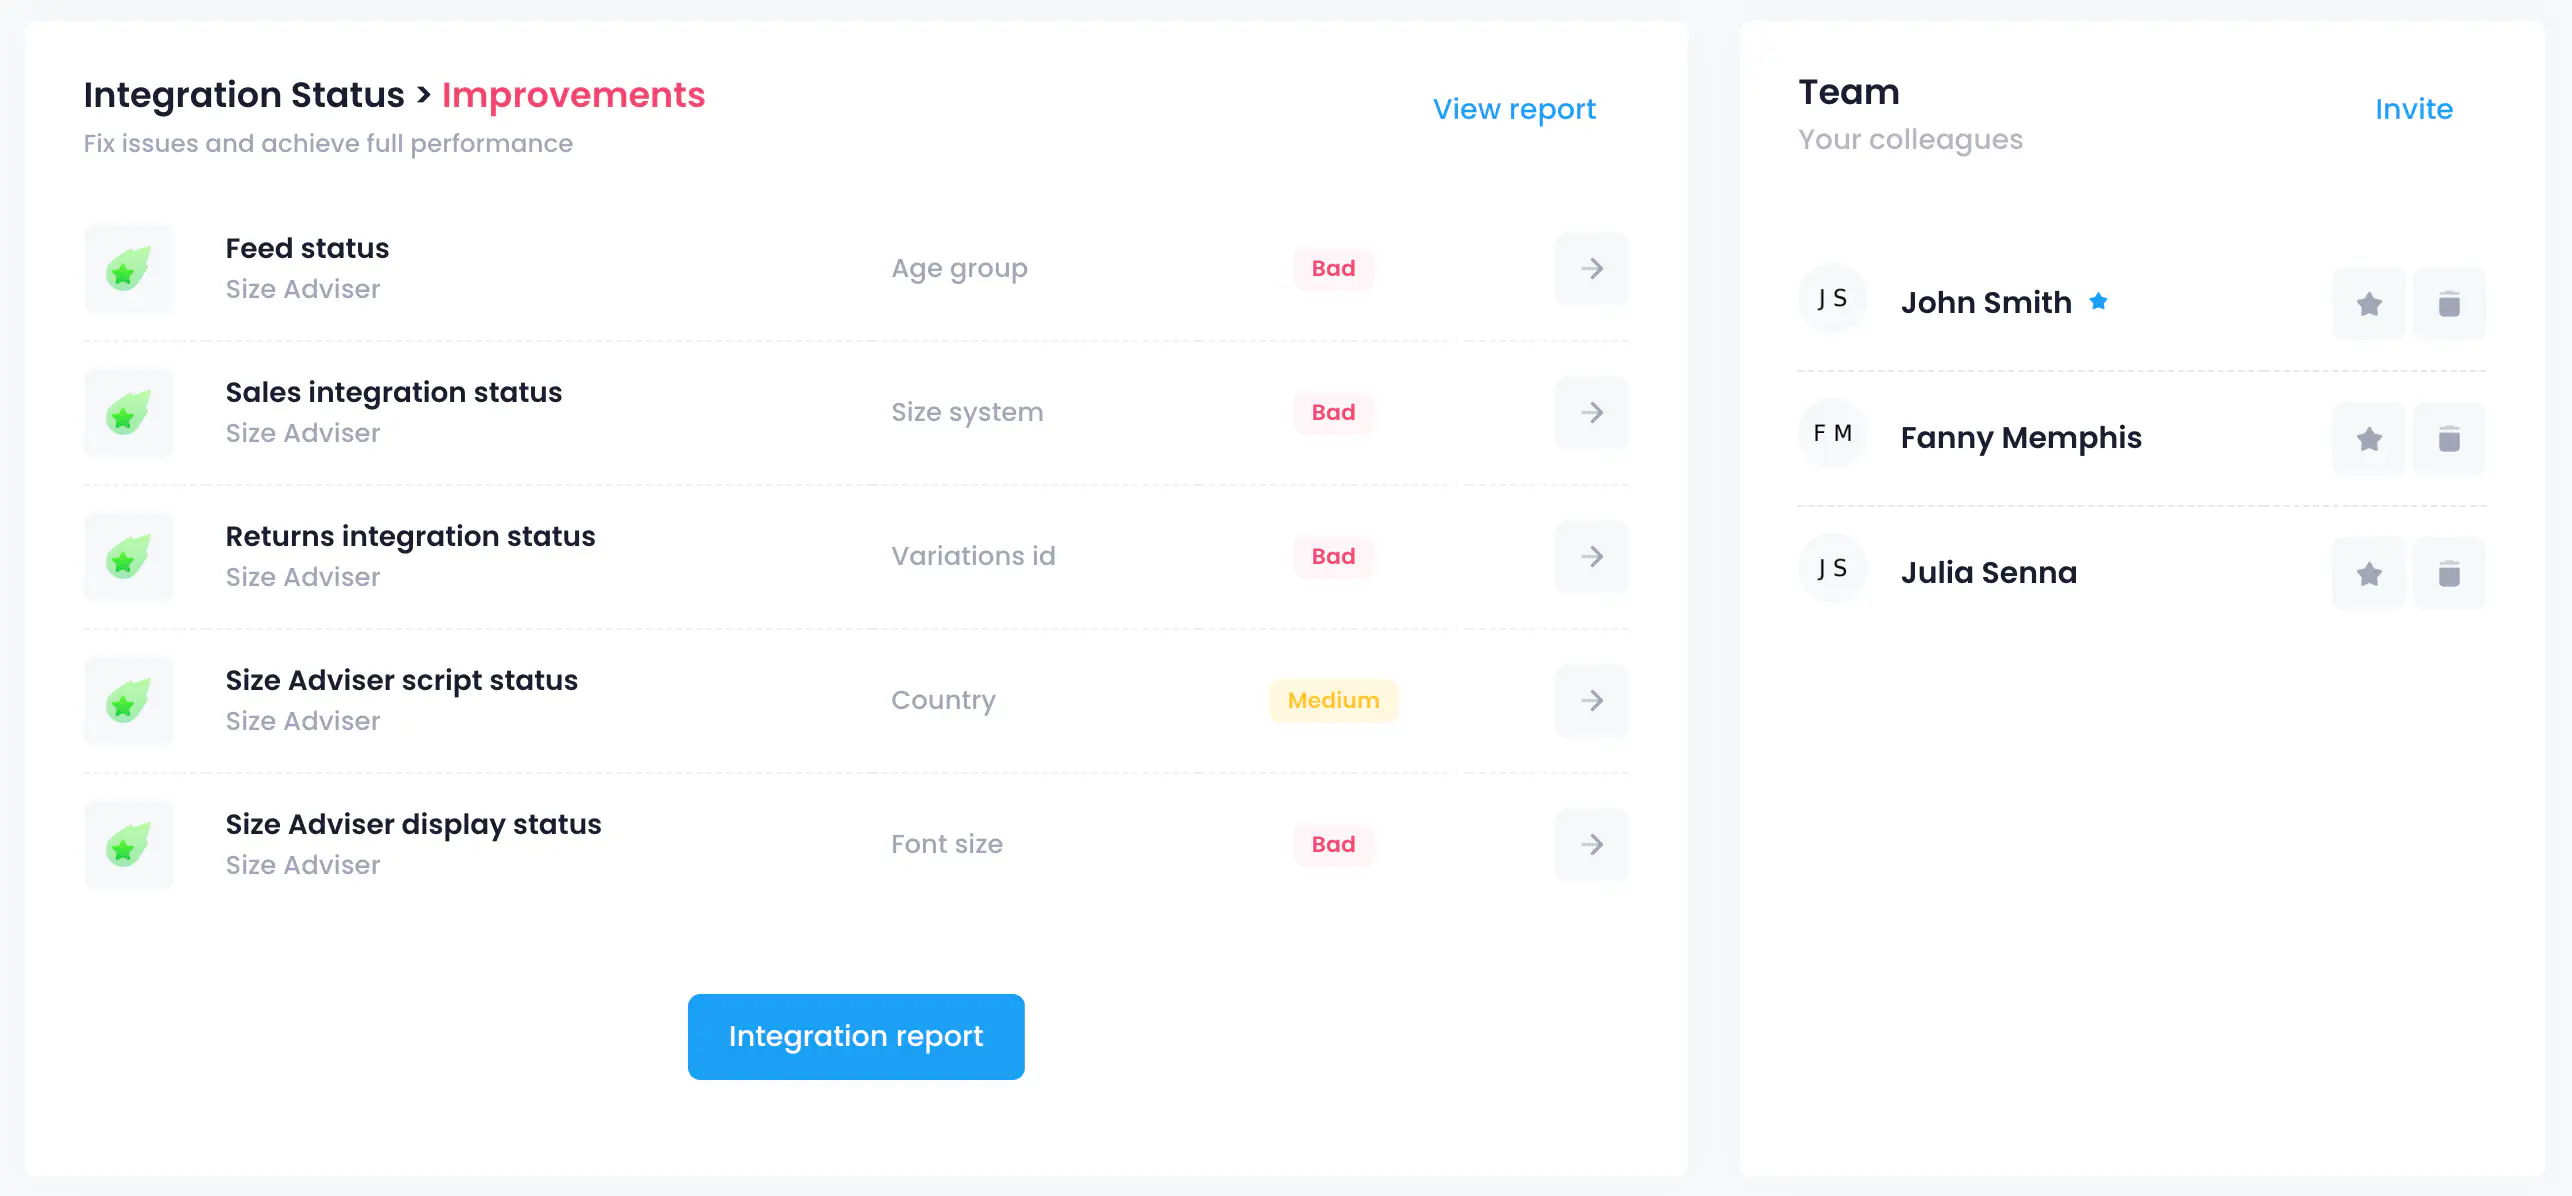
The following section displays a summary of your integration status, highlighting the most important points to improve in order to get the best performance out of Usizy for your business, and to delight your shoppers. For a more detailed report on your integration status, you can click on the “View report” button, which is available both in the Integration Status section and on the Statistics page within the Size Adviser section.
The Team section allows you to manage all users access to your Usizy dashboard. You can view which team members have permission to access the dashboard or invite other users.
If you are a user with admin rights, you also have the authority to remove other team members, as well as grant or remove admin rights from other users.
The next section on the Overview page displays a summary of analytics and key performance indicators (KPIs) related to your eCommerce business.
It is important to note that the data, KPIs, and metrics presented on this dashboard are based solely on sessions to product pages. As a result, sessions to other pages such as home pages, category listings, and search pages are not considered or tracked in the results displayed on this dashboard.
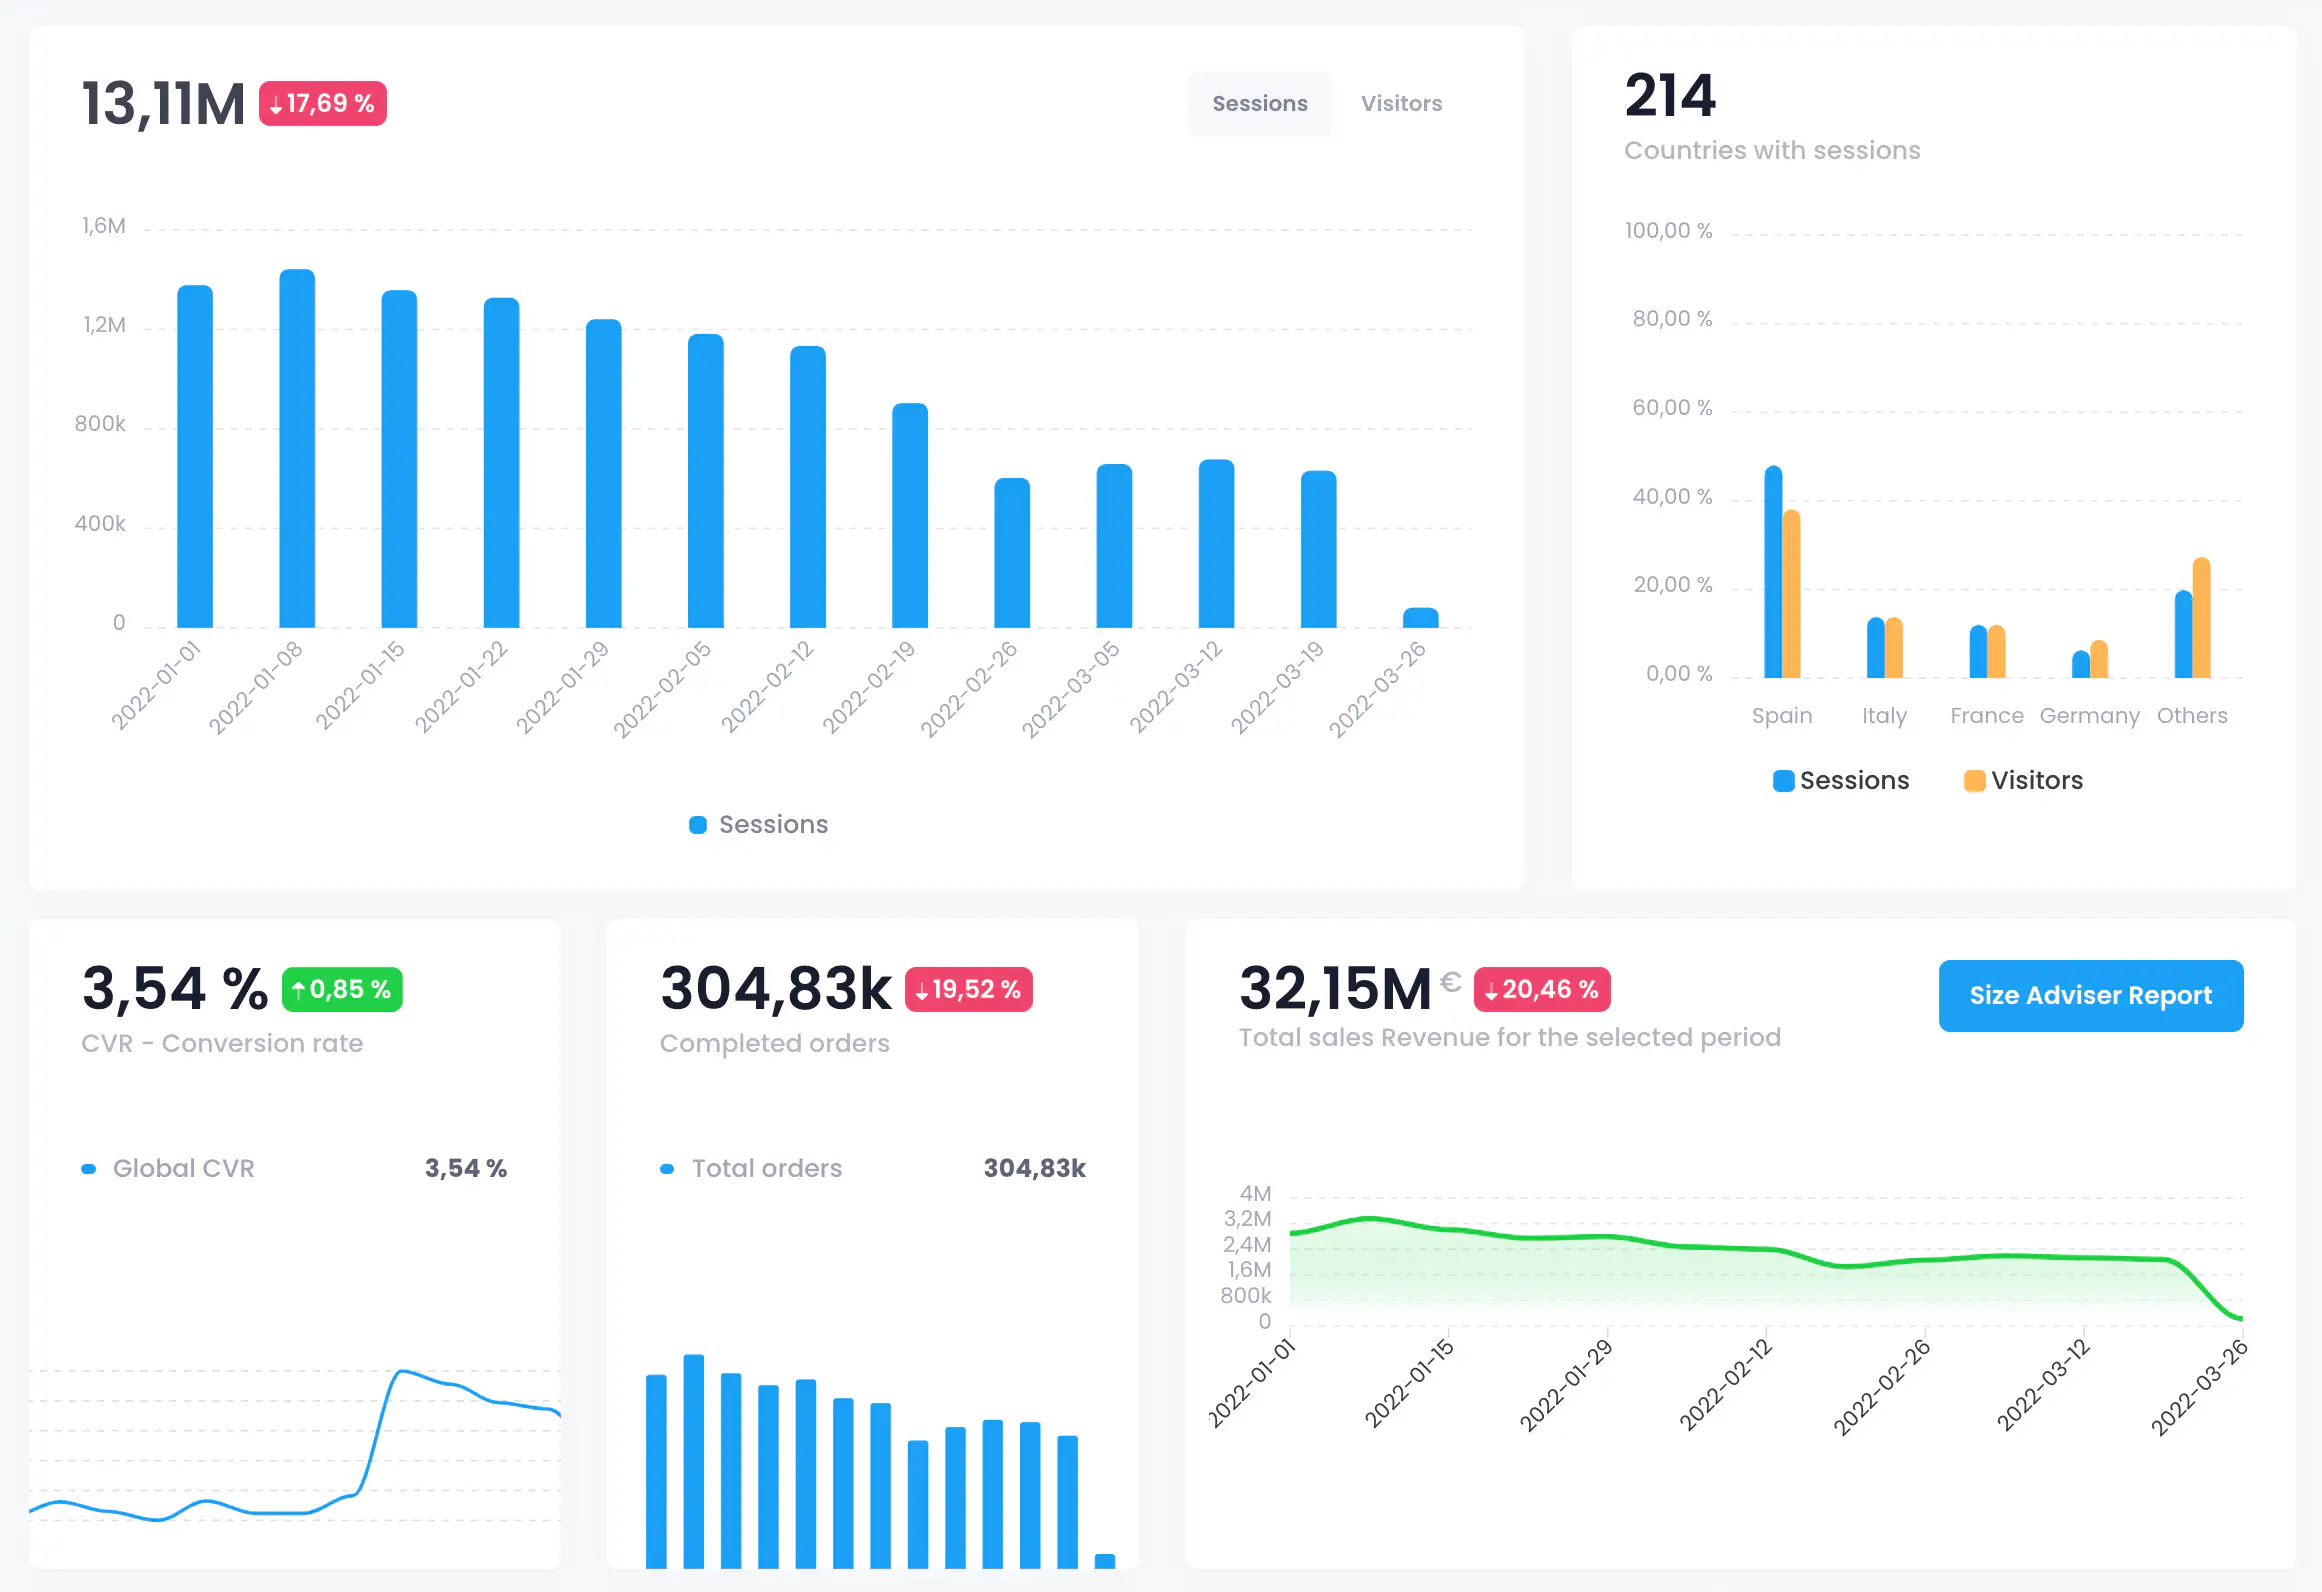
The Overview page provides a comprehensive list of available metrics that help you track and analyse your eCommerce business performance. The available metrics include:
- Total sessions and their timeline distribution
- A session remains active as long as a visitor keeps being active on the website within a 30-minute window. Beyond that or after 12pm at night, any new interaction will be counted as a new session.
- Total visitors and their timeline distribution.
- A visitor will remain identified anonymously through a unique identifier, as long as he or she browses from the same browser and the same device, or until he or she clears his or her cookies.
- A visitor can have one or more sessions during a given period.
- Sessions and visitors distributed by country
- Volume of sessions and visits along with their country distribution
- CVR - Sales Conversion rate
- Volume of orders
- Total sales
- Average ticket per buyer or order
- Average number of orders per buyer or order
- Global return rate and Return rate due to size error
- Volume of returns (globally and due to size)
- Volume of total brands and covered brands
- Volume of total, covered, and pending products
Please note that our metrics are calculated considering visitors, as opposed to sessions, as a visitor is the closest entity to a physical person. Considering visitors will help analyse your shoppers’ behaviour more objectively.
Reviewing these metrics will help you gain valuable insights into your eCommerce business’s performance and identify areas of improvement, to increase your sales and revenue.